modules:46376
Table of Contents
| DATA ANALYTICS REFERENCE DOCUMENT |
|
|---|---|
| Document Title: | 46376 - Web App Development |
| Document No.: | 1548351190 |
| Author(s): | Rita Raher, Gerhard van der Linde |
| Contributor(s): | |
REVISION HISTORY
| Revision | Details of Modification(s) | Reason for modification | Date | By |
|---|---|---|---|---|
| 0 | Draft release | 46376 - Web App Development | 2019/01/24 17:33 | Gerhard van der Linde |
46376 - Web App Development
Learning Outcomes
- The design, development and deployment of web applications using HTML, CSS and JavaScript
- The architecture of the World Wide Web
- Creating a web application with Data Driven Document Framework (D3)
Course Structure
- 13 Weeks
- Lectures and reading material
Assessment and Marking
- Week 4 - MCQ Assesment (10%)
- Week 8 - MCQ Assesment (20%)
- Week 12 - MCQ Assesment (20%)
- Final Project (50%)
Course Outline
- HTML - Beginning Week 1
- CSS - Beginning Week 3
- JavaScript - Beginning Week 5
Resources
- W3Schools: http://www.w3schools.com/
- HTML Dog: http://htmldog.com/
- W3C Markup Validation Service: https://validator.w3.org/#validate_by_input
- HTML-Validator: https://www.freeformatter.com/html-validator.html
Week 1 - Introduction
- Welcome to Web Application Development
- The Evolution of the World Wide Web
- Hello World Wide Web!
The Evolution of the World Wide Web
- The internet - A global network of computers using various protocols
- The world Wide Web - A way of accessing information over the medium of the internet
- ARPANET - 1969 - 1990
- Tim Berners-Lee
- Cern
- March 1989
- Included HTML - Hypertext Markup Language
Early Web Pages
- Basic Functionality lacking fonts, colour of advanced presentation
- CSS - Cascaded Style Sheets - Created for presentation
- 1990 - HTML
- 1994 - CSS version 1
- 1995 - HTML v2
- 1995 - JavaScript
- 1998 - CSS v2
- 1999 - CSS v3 - numerous updates since
- 2014 - HTML v5
Current Web Versions
- HTML v5
- CSS v3
- JavaScript v1.8.5
- Versions are browser dependent
- W3C publishes standards
- Not all browsers support HTML5
Most Popular Browsers
- Google Chrome - 73%
- Firefox - 15.5%
- IE(Edge) - 4.8%
- Safari - 3.5%
- Opera - 1.1%
HTML5 Browser compatibility testing - https://html5test.com
Purpose
- HTML - Structure
- CSS - Presentation
- JavaScript - Behaviour
Hello World Wide Web!
Week 2 - HTML Coding
References
Related External Links
W3c validator Service: https://validator.w3.org/#validate_by_input
W3C Recommendations on HTML code structure and doctype declaration
https://www.w3.org/QA/2002/04/valid-dtd-list.html
Note Indentation example on this basic page
http://w3c.github.io/html/syntax.html#the-doctype
Lists
w3Schools resource on lists; note other attributes that can be used in lists
http://www.w3schools.com/html/html_lists.asp
W3.ORG on Lists: https://www.w3.org/TR/html40/struct/lists.html
Semantic Markup
Part 1: Installing a Development Environment & HTML document structure
- Find and install notepad++1)
- Create a html body framework
- Create a sample html document
- mypage.html
<!doctype html>
 <head>
  <title>My Web Page</title>
 </head>
 <body>
<h1>The History of the World Wide Web</h1>
<h3>Tim Berners Lee and the Development of HTML</h3>
<p>The World Wide Web ("WWW" or simply the "Web") is a global information medium which users can read and write via computers connected to the Internet. The term is often mistakenly used as a synonym for the Internet itself, but the Web is a service that operates over the Internet, just as e-mail also does. The history of the Internet dates back significantly further than that of the World Wide Web.</p>
<h3>Precursors</h3>
<p>The hypertext portion of the Web in particular has an intricate intellectual history; notable influences and precursors include Vannevar Bush's Memex, IBM's Generalized Markup Language, and Ted Nelson's Project Xanadu. Paul Otlet's Mundaneum project has also been named as an early 20th century precursor of the Web.
The concept of a global information system connecting homes is prefigured in "A Logic Named Joe", a 1946 short story by Murray Leinster, in which computer terminals, called "logics," are present in every home. Although the computer system in the story is centralized, the story anticipates a ubiquitous information environment similar to the Web.</p>
<h3>1980-1991: Invention and implementation of the Web</h3>
<p>In 1980, Tim Berners-Lee, an English independent contractor at the European Organization for Nuclear Research (CERN) in Switzerland, built ENQUIRE, as a personal database of people and software models, but also as a way to play with hypertext; each new page of information in ENQUIRE had to be linked to an existing page. Berners-Lee's contract in 1980 was from June to December, but in 1984 he returned to CERN in a permanent role, and considered its problems of information management: physicists from around the world needed to share data, yet they lacked common machines and any shared presentation software.</p>
 </body>
</html>
Part 2: Lists, Semantic Markup, Comments, Indentation and Validation
Ordered HTML List - The Type Attribute
- type=“1” The list items will be numbered with numbers (default)
- type=“A” The list items will be numbered with uppercase letters
- type=“a” The list items will be numbered with lowercase letters
- type=“I” The list items will be numbered with uppercase roman numbers
Improve readability of your code
- use comments
- indent your code
Validating your code
Add links to your code
To open on in a new tab
target=“_blank”
- mytable.html
<!DOCTYPE html>
<html>
<head>
	<title>My Table</title>
</head>
<body>
	<table border="3" cellpadding="5" cellspacing="0"
	align="center" bgcolor="yellow">
		<tr>
			<th width="75">cell 1</th>
			<th width="75" bgcolor="grey">cell 2</th>
			<th width="75">cell 3</th>
		</tr>
		<tr align="center">
			<td rowspan="2" bgcolor="red">cell 4</td>
			<td colspan="2"><a href="http:\\www.amazon.co.uk">cell 5</a></td>
		</tr>
		<tr align="center">
			<td>cell 8</td>
			<td>cell 9</td>
		</tr>
	</table>
</body>
</html>
Lab exercise week 2
Week 3 - Linking, Images and Forms
Part 1: Linking to internal webpages
Related External Links
Information from W3C on URLs:
https://www.w3.org/TR/WD-html40-970917/htmlweb.html
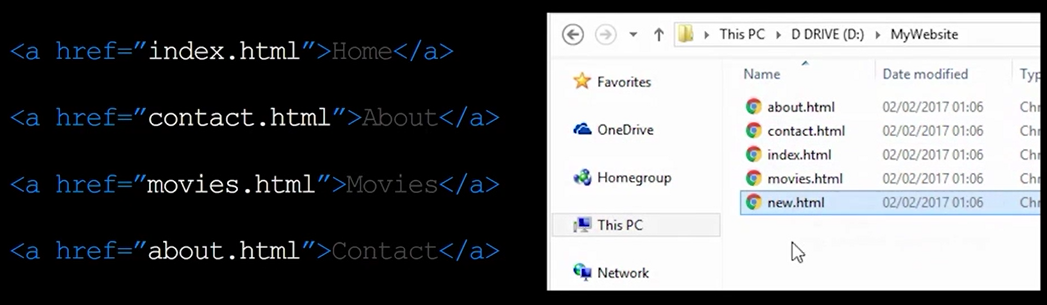
All files are in the same folder and referenced directly in links.
Directory Structure
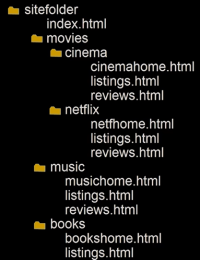
Folder and directories are used interchangeably.
Folders are refered to as Chold, Parent, Garndchild and Grandparent similar to family trees.
Understanding relative URL's is important when referencing files in folders and subfolder or parent folders.
Part 2: Images in HTML
# img is a void tag, no open and close, all inside tag
<img src="images/pic1.jpg">
# alt tag
<img src="images/pic1.jpg" alt="Picture Info">
#dimensions is pixels
<img src="images/pic1.jpg" alt="Picture Info" width="100" height="100">
Supported file formats
| ext | description | comments |
|---|---|---|
| .jpeg | joint photographic experts group | technically not a file format but a method to compress images |
| .jpg | ||
| .gif | 8 buts per pixel, not good for photos. Supports animated and transparent images. | |
| .png | portable network graphics | losless compression, supports tranparency |
Part 3: Troubleshooting Images and links
Part 4: Forms and Form Controls in HTML
Related Resources Sample code for form controls provided underneath in related code
External Resources W3C resource on Form Controls
Part 5: Validation and Input in HTML5
Related Resources
Part 6: Additional HTML
Related Resources
Lab Exercise
Week 4 - Cascading Style Sheets
CSS- The Box Model
CSS work by associates styles with HTML elements
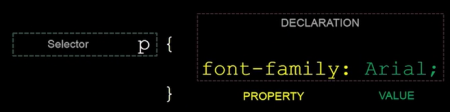
Selector decoration → properties value
This rule applies to all paragraphs, denoted by the p tag.
 p {
	font-family: Arial;
}
There can be multiple rules
font-family: Arial, Verdana, sans-serif;
CSS - Internal CSS
<head>
	<title>Using Internal CSS</title>
  <style type=“text/css”>

	body{
	font-family: arial;
	background-colour: yellow;
	}
	h1{
	color:red;
	}
  </style>
</head>
CSS SELECTORS
| Universal | * {} |
|---|---|
| Type | h1, h2, h3 {} |
| Class | .note {} p.note{} |
| ID | #introduction{} |
CSS - Foreground Color
h1{
 color: cyan;
}

h2{
color:  #00ffff;
}

h3{
 color: rgb(0,255.255);
}

h4{
	color: rgba(100, 100, 90, 0.5)
}
Typeface
- SERIF
- SANS-SERIF
- monospace
Font size
- font-size: 200%;
- font-size: 2em;
- Font-size: 12px;
Specify a font type not installed on a computer by specifying a url.
@font-face{
font-family: ‘ChunkyFiveRegular’;
src: url(‘fonts/chuckfive.eot’);
}
- text-transform:uppercase; # or lowercase or capatilize
- text-decoration: underline;
- text-decoration: none;
- text-indent: 20px
- text-shadow:1px 2px 0px #000000; # right, down, blur, colour
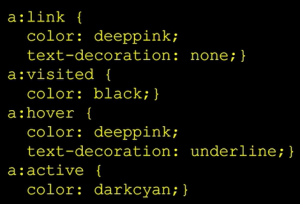
Styling of links
CSS Box Model
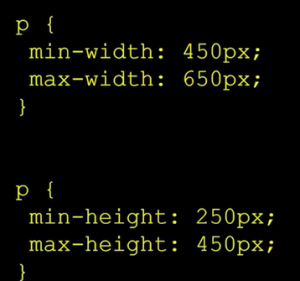
CSS- Width and Height
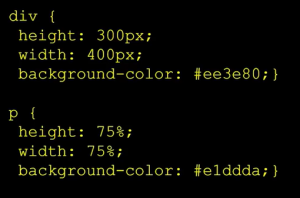
- min-width:450px;
- max-width:650px;
- min-height:250px;
- max-height:900px
Overflow
- overflow:hidden;
- overflow:scroll;

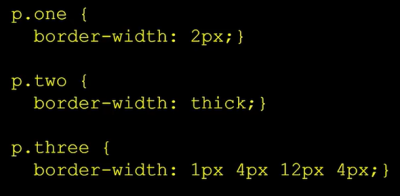
border, margin, padding

- border-width:2px
- border-width:thick # thin and medium
- border-width:1px 4px 4px 4px; # size for each side, clockwise starting top
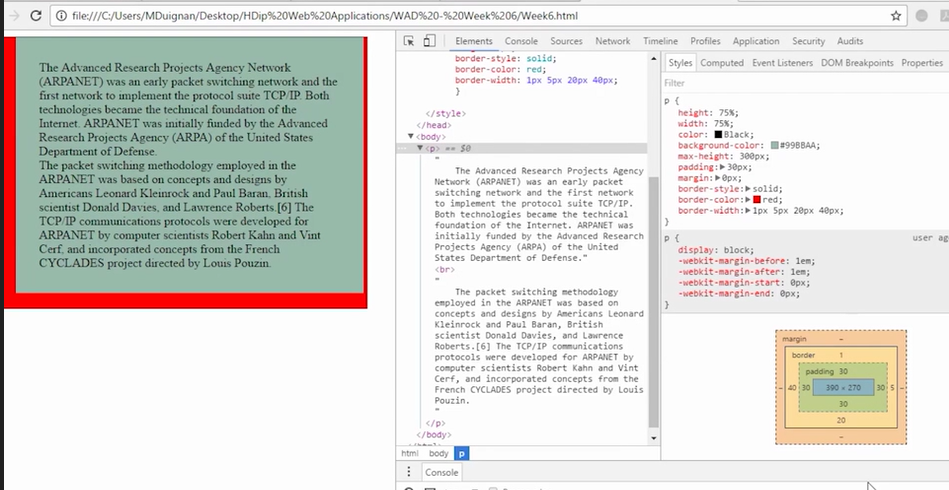
- border-style: double; # solid, dotted, dashed, groove, ridge, inset and outset
- border-color: red;
- border-color: red pink cyan black; # for each side
- border:3px solid red; # border shorthand, must be in this order, size, style and colour
- padding: 10px
Use inspector
p{
	text-align: center # left, right, justify
}
Centering content
margin: 0 auto
Week 5 - Positioning with CSS and Introduction to JavaScript
External refernces
CSS: Layout
- Block level elements begin on a new line
- inline elements: exist between surrounding text
Css - positioning elements
- static (Normal Flow)
- div {position: fixed;}
- div{ position: relative;}
- div{position: absolute;}
Set the position property first then left or right
Fixed Positioning
- An element with position: fixed is positioned relative to the viewport or window
- This means that it will stay in the same place even if the page is scrolled.
- The top, right, bottom, and left properties are used to position the elements.
- A fixed element does not leave a gap in the page where it would normally have been located.
CSS Code
.d1{
    position: fixed;
    top: 20px;
    left: 50px;
    background-color: blue;
}
HTML Code
Relative positioning
An element with position: relative is positioned relative to its normal position.
Setting the top, right, bottom, and left properties of a relatively-positioned element will cause it to be adjusted away from its normal position.
Other content will not be adjusted to fit into any gap left by the element.
CSS Code
.d1{ position: relative; top: 30px; left: 10px; background-color: blue; }
Absolute Positioning
An element with position: absolute is positioned relative to the nearest positioned ancestor.
If an absolute positioned ancestors, it uses the document body, and moves along with page scrolling.
Parent container must have a position other than static
CSS Code
.d2 { position: absolute; top: 20px; background-solor: blue; } .d3 { positioning: relative; background-color: orange; }
HTML Code
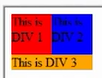
Part 2- Float and Clear in CSS
How to position block elements beside each other
div{ float:left; clear:left }
CSS Code
.d1 { float: left; width 50px; height: 50px; background-color: red; } .d2 { float: left; width 50px; height: 50px; background-color: blue; } .d3 { clear: left; float: left; width 100px; background-color: orange; }
HTML Code
<div class="d1"> This is DIV 1 </div> <div class="d2"> This is DIV 2 </div> <div class="d3"> This is DIV 3 </div>
Part 3: Introduction to JavaScript
JavaScript is not Java. 
Place the script tag after the closing HTML body tag
<script>
document.write(“Hello World!”);
alert(“Hello again world”);

</script>
<script>
var myVar = “Hello from a variable”;

document.write(myVar);

</script>
Part 4: The Basics of JavaScript
Statements
Individual step in scripts are known as statements
Statements should end with a smile-colon ;
document.write(‘Welcome!’);
Comments
Comments explain the code
Help you remember it and others understand it
multi-line comment
/* anything between these characters is a comment
and will not be processed */
single-line comments
// Anything after the two forward slashed
// is also a comment and
// will not be processed
Variables
Scripts often need to store bits of information temporarily in order to perform tasks.
These bits of information - or data - are stored in variables
Declaring a variable
var quantity;

// keyword -> variable name

quantity = 3
Data types
- Numbers
- Strings
- Booleans
Javascript distinguishes between number, string and true or false values known as booleans.
| Numbers | no integers, logs, shorts or floats, just numbers stored as 64 bit double precisonion float. |
|---|---|
| Strings | enclosed in quotes or double quotes but they must match. |
| Boolean | true or false. |
Operators
| Arithmetic | |
|---|---|
| Operator | Description |
| + | Addition |
| - | Subtraction |
| * | Multiplication |
| ** | Exponentiation (ES2016) |
| / | Division |
| % | Modulus (Division Remainder) |
| ++ | Increment |
| – | Decrement |
| Assignment | ||
|---|---|---|
| Operator | Example | Same As |
| = | x = y | x = y |
| += | x += y | x = x + y |
| -= | x -= y | x = x - y |
| *= | x *= y | x = x * y |
| /= | x /= y | x = x / y |
| %= | x %= y | x = x % y |
| Comparison | |
|---|---|
| Operator | Description |
| == | equal to |
| === | equal value and equal type |
| != | not equal |
| !== | not equal value or not equal type |
| > | greater than |
| < | less than |
| >= | greater than or equal to |
| <= | less than or equal to |
| ? | ternary operator |
| Logical | |
|---|---|
| Operator | Description |
| && | logical and |
| || | logical or |
| ! | logical not |
Bit operators work on 32 bits numbers. Any numeric operand in the operation is converted into a 32 bit number. The result is converted back to a JavaScript number.
| Bitwise | |||||
|---|---|---|---|---|---|
| Operator | Description | Example | Same as | Result | Decimal |
| & | AND | 5 & 1 | 0101 & 0001 | 0001 | 1 |
| | | OR | 5 | 1 | 0101 | 0001 | 0101 | 5 |
| ~ | NOT | ~ 5 | ~0101 | 1010 | 10 |
| ^ | XOR | 5 ^ 1 | 0101 ^ 0001 | 0100 | 4 |
| << | Zero fill left shift | 5 << 1 | 0101 << 1 | 1010 | 10 |
| >> | Signed right shift | 5 >> 1 | 0101 >> 1 | 0010 | 2 |
| >>> | Zero fill right shift | 5 >>> 1 | 0101 >>> 1 | 0010 | 2 |
Javascript uses mathematics to perform tasks
var width = 3;
var height = 2;

area = width * height;
Concatenating strings
There is just one string operator: the + symbol.
It is used to join strings on either side of it
var greeting = “Hello”;
var who = “world”;

var message = greeting + who;
Basic input and output
// writes to the page
document.write(‘Welcome!’);

// popup with the message displayed
alert(“my output here “);
Adding two numbers using a variable for result
var num1 = 3;
var num2 = 4;
var result= num1 +num2;

document.write(result);
var num1 = 3;
var num2 = 4;

document.write(num1 +num2);
Prompting the user for an input
// user input
var myInput;
myInput = prompt(“Please enter your name:”);

// writes a string + input
document.write(“Hello ” + myInput);
Asking for two numbers and then adding together
var num1;
var num2;

num1 = prompt(“Please enter first number”);
num2 =  prompt(“Please enter second number”);

// convert to a number
num1 = Number(num1);
num2 = Number(num2);

document.write(num1 +num2);
var num1;
var num2;

num1 = Number(prompt(“Please enter first number”));
num2 =  Number(prompt(“Please enter second number”));

document.write(num1 +num2);
Week 6 - Decisions and loops in Javascript
A script can do different things depending on what values it has been passed.
Making Decisions
using if statements
// if score is greater than 40
if(score > 40){
	document.write(‘you passed!’);
} else {
	document.write(’Try again...!’);
}
Comparison operators
== //is equal to
!=  //is not equal to
>  //greater than
< //Less than
>= //greater than or equal to
<= //Less than or equal to
Logical Operators
// && logical and
if ( score > 75) && (score <95){
	document.write(‘very good!’);
}

//|| logical or
if ( score > 75) || (score <95){
document.write(‘very good!’);
}

// ! logical not
Loops
for(var i=0; i<3;i++){
	document.write(i);
}
initialisation: var i=0 condition: i < 3 update: i++
Decisions and Loops (Code example)
var myInput = Number(prompt(“please enter a score:”));

if (myInput > 40 ){
	document.write(“You passed!”);
} else {
	document.write(“Try again!”);
}
var numIn = Number(prompt(“Please enter a number:”));

for (var i = 1; i <= numIn; i++){
    document.write(i + “<br>");
}
Functions
No numbers, no reserved words or variables for a function name
Also it is common to use camelCase
function sayHello(){
 document.write(‘Hello’);

}
Calling a function
sayHello();
function helloWorld(){
    document.write("hello from a function!");
}
helloWorld();
Calling a function when a button is clicked
<button type="button" name="button" onclick="helloWorld()">Click me!</button>
The function being called
function helloWorld(){
    document.write("hello from a function!");
}
A function being called when you click a button and an alert box appears
<button type="button" name="button" onclick="helloWorld()">Click me!</button>
function helloWorld(){
    alert("hello from a function!");
}
Declaring a function that needs information
//parameters when defining the function: width, height

function getArea(width, height){
	document.write(width*height);
}

// arguments when calling the function (3, 5)
getArea(3, 5);
function getArea(width, height){
    alert(width * height);
}

getArea(3, 5);
Using Variables
function getArea(width, height){
    alert(width * height);
}

var num1 = 10;
var num2 =6;
getArea(num1, num2);
Returning from a function
function getArea(width, height){
    return width * height;
}
function getArea(width, height){
    return width * height;
}

var x = getArea(3, 9);
alert(x);
Week 7 - The Document Object Model

To access and update the HTML, first you select the element(s), you want to work with.
Here are some of the ways to select elements
They are known as DOM queries.
How to specify a heading in JavaScript?
<h1>This is my heading</h1>
<h1>This is another heading</h1>
<h1>This is yet another heading</h1>
Easiest way is to do this is to assign each one an ID
HTML
<h1 id="one">This is my heading</h1>
<h1 id="two">This is another heading</h1>
<h1 id="three">This is yet another heading</h1>
JavaScript
// get the element with an id of two
document.getElementById("two");
To access and update content you can use:
InnerHTML for text and markup value for input boxes

For an Input box

Part 1 : Intro to the DOM
Demo
HTML
<h1>This is my first heading</h1>
<h1 id="two">This is my second heading</h1>
<h1>This is my third heading</h1>
JavaScript
// get the element with an id of two and the title
var x = document.getElementById("two").innerHTML;
alert(x);
Part 2 : DOM query examples
Demo 2
HTML
<input id="in1">
<button onclick="myName()">Check name</button>
<h1 id="result"></h1>
JavaScript
// gets input text when the button is clicked and updates the h1
function myName(){
   var x = document.getElementById("in1").value;
   document.getElementById("result").innerHTML = "Hello" + x;
}
Part 3: Styling with the DOM (A)
Style
DOM Query Selectors
changing Style
HTML
<h1 id="two">My Article Heading</h1>
JavaScript
//targeting the color
document.getElementById("two").style.color;
Changing the heading color
HTML
<h1 id="one">This is a Heading</h1>
<button onclick="change()">Change to red</button>
JavaScript
// change color to red

function change(){
   document.getElementById("one").style.color ="red";

}
Part 4: Styling with the DOM (B)
Changing the background color
HTML
<body id="bdy">

<button onclick="changeBackground()">Change background</button>
</body>
JavaScript
function changeBackground(){
  document.getElementById("bdy").style.background ="yellow";

}
Part 5: Styling with the DOM (C)
Demo
HTML
<p id="para">
Lorem ipsum dolor sit amet, consectetur adipiscing elit, sed do eiusmod tempor incididunt ut labore et dolore magna aliqua. Ut enim ad minim veniam, quis nostrud exercitation ullamco laboris nisi ut aliquip ex ea commodo consequat. Duis aute irure dolor in reprehenderit in voluptate velit esse cillum dolore eu fugiat nulla pariatur. Excepteur sint occaecat cupidatat non proident, sunt in culpa qui officia deserunt mollit anim id est laborum.
</p>

<button onclick="change()">Change me</button>
JavaScript
function change(){

   document.getElemntByID("para").style.background="green";
   document.getElemntByID("para").style.border="3px dashed red";
   document.getElemntByID("para").style.fontfamily="Arial";

}
using a variable for document.getElemntByID
function change(){
   var par = document.getElemntByID("para")
   para.style.background="green";
   para.style.border="3px dashed red";
   para.style.fontfamily="Arial";
   para.style.boxShadow="10px 20px 30px grey";

}
Week 8 - Working With JavaScript
Part 1: Troubleshooting with the browser
This feature provides some information on troubleshooting your code using Chrome and other browsers
External Resources: https://www.w3schools.com/js/js_debugging.asp
Part 2: Dynamic Typing in JavaScript
External Resources: https://www.w3schools.com/js/js_datatypes.asp
Strings in JavaScript: https://www.w3schools.com/js/js_strings.asp
Numbers in JavaScript: https://www.w3schools.com/js/js_numbers.asp
Booleans in JavaScript: https://www.w3schools.com/js/js_booleans.asp
JavaScript Types
- Number
- String
- Boolean
- Null
- Undefined
Java script used dynamically typed variables.
Dynamically typed languages assigns variables a type at runtime based on the variables value at the time.
Statically type languages specify what type a variable will use.
Using the built in development console in web browsers to test JavaScript code.
Right click and select developer console, (F12)
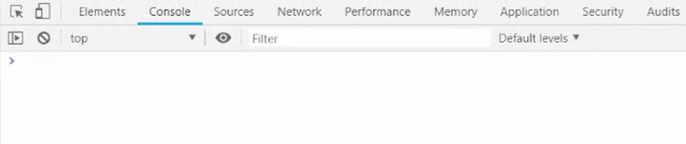
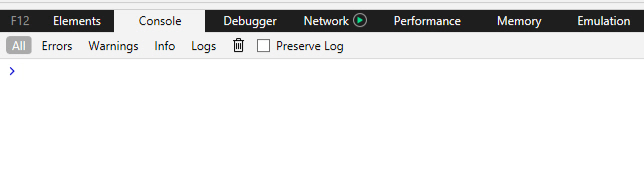
>myVar="Hello"
<"Hello"
>typeof myVar
<"string"
>myVar=true
<true
>typeof myVar
<"boolean"
>num=0
<0
>num+=1
<1
Part 3: Type Coercion In JavaScript
External Resources
Coercion in JavaScript: https://medium.freecodecamp.org/js-type-coercion-explained-27ba3d9a2839
See chapter 1 of book Eloquent JavaScript for information on coercion in JavaScript: https://eloquentjavascript.net/01_values.html
>5+10
<15
>"Hello" + " World"
<"Hello World"
>5+"hello"
<"5hello"
>5+"10"
<"510"
>5*"10"
<50
>5/"10"
<0.5
>5-"10"
<-5
>5-"Hello"
<NaN
>50+true
<51
>50-true
<49
>50-false
<50
>50+false
<50
>"Hello"+true
<"Hellotrue"
>"Hello"+false
<"Hellofalse"
Part 4: Comparison Operators In JavaScript
External Resources
Comparison Operators in JavaScript: https://www.w3schools.com/js/js_comparisons.asp
>4==4
<true
>4==41
<false
>4=="4"
<true
>4===4
<true
>4==="4"
<false
>"4"==="4"
<true
>1==true
<true
>0==false
<true
>1===true
<false
>0===false
<false
>4!=5
<true
>5!="Hello"
<true
>4!="4"
<false
>4!=="4"
<true
Week 9 - Introduction to D3
Part 1 - Introduction to D3.js
https://d3js.org/ 2) 3) Data-Driven Documents
D3.js - Overview
Purpose
D3(Standing for Data-Driven Documents) is a JavaScript library for producing dynamic, interactive data visualizations in web browsers.
Capabilities
- Principal functions allow for selections, transitions an data-binding.
- D3 can select elements in the DOM programmatically(can use instead of the verbose DOM API)
- By declaring a transition, styles can be smoothly interpolated/animated over a certain time.
- Large datasets(e.g JSON/XML format) can be easily bound to svg objects using simple D3.js functions to generate rich text/graphic charts and diagrams.
Technologies
- Built on top of common web standards liek HTML, CSS, JavaScript the DOM and SVG
- Exportable nature of SVG enables graphics created by D3 to be used in print publications.
Origins
- Initially released in 2011(successor to the earlier Protovis framework) - Now used widely (e.g by the New York Times, OpenStreetMap etc.)
- Recent version -v4 has big breaks in the API from previous versions
Part 2 - Introduction to SVGs and XML
Scalable Vector Graphics
D3.js - SVG
- SVG(Scalable Vector Graohics) is an XML format used for drawing
- SVG also has a DOM - there are elements with parents and children and attributes, and you can respond to the same mouse/touch events
- CSS styles and selectors can apply to SVG elements
SVGs have the following structure:

</code>
Demo:
  <svg width="1000" height="500">
    <rect width="50" height="20" fill="red"/>
  </svg>
You can use classes
.myClass {border:2px solid black}
  <svg class="myClass" width="1000" height="500">
    <rect width="500" height="200" fill="red"/>
  </svg>

Use x to move from the left
  <svg class="myClass" width="1000" height="500">
    <rect x="100" width="500" height="200" fill="red"/>
  </svg>

Use y to move from the top
- svg_1.html
<!doctype html>
<html lang="en">
 <head>
  <meta charset="UTF-8">
  <meta name="Generator" content="EditPlus®">
  <meta name="Author" content="">
  <meta name="Keywords" content="">
  <meta name="Description" content="">
  <title>Document</title>
  <style type="text/css">
	.myClass {border:2px solid black}
</style>
 </head>
 <body>
  <svg class="myClass" width="700" height="500">
    <rect x="10" y="10" width="500" height="200" fill="red"/>
    <rect x="60" y="180" width="500" height="200" fill="blue"/>
  </svg
 </body>
</html>

Part 3 - Circles in SVGs
.myClass {border:2px solid black}
  <svg width="1000" height="1000" class="myClass">
    <circle r="50" cy="100" cx="200" fill="green" />
  </svg>

Stroke
  <svg width="1000" height="1000" class="myClass">
    <circle r="50" stroke="blue" stroke-width="20" cy="100" cx="200" fill="green" />
  </svg>

Part 4 - Using D3 to create SVGs
Using D3 to create SVGs
- Include link reference to D3:
<script src="https//d3js.org/d3.v5.min.js"></script>
Using D3.js to create elements
- Create an SVG container in the HTML page
- Access the SVG elements using an associated ID
<svg width="1000" height="1000" id="mySVG">
- The SVG can be targeted using a D3 selector in JavaScript:
var svgConatiner = d3.select("#mySVG");
- Elements (such as a rectangle) can then be appended to the svg container:
var myRectangle = svgContainer.append("rect");
The appended element can then have attributes set:
myRectangle.attr("x",100 );
myRectangle.attr("y", 100);
myRectangle.attr("height", 50 );
myRectangle.attr("width", 600 );
myRectangle.attr("fill", "orange" );
Part 5 - D3: Select, Append, and Attr with method chaining
<!DOCTYPE html>
<html>
<head>
 <script src="https//d3js.org/d3.v5.min.js"></script>
</head>
<body>
  <svg width="1000" height="1000" id="mySvg">
  </svg>

</body>
</html>

<script>
var svgContainer = d3.select("#mySvg");
var myRectangle = svgContainer.append("rect");

myRectangle.attr("x", 100);
myRectangle.attr("y", 100);
myRectangle.attr("height", 50);
myRectangle.attr("width", 200);
myRectangle.attr("fill", "orange");
</script>

Method chaining
<!DOCTYPE html>
<html>
<head>
 <script src="https//d3js.org/d3.v5.min.js"></script>
</head>
<body>
  <svg width="1000" height="1000" id="mySvg">
  </svg>

</body>
</html>

<script>
var svgContainer = d3.select("#mySvg");
//method chaining
var myRectangle = svgContainer.append("rect")
   .attr("x", 100)
   .attr("y", 300)
   .attr("height", 15)
   .attr("width", 200)
   .attr("fill", "green");
</script>

<!DOCTYPE html>
<html>
<head>
 <script src="https//d3js.org/d3.v5.min.js"></script>
</head>
<body>
  <svg width="1000" height="1000" id="mySvg">
  </svg>

</body>
</html>

<script>
var svgContainer = d3.select("#mySvg");
//method chaining
var myRectangle = svgContainer.append("rect")
   .attr("x", 100)
   .attr("y", 300)
   .attr("height", 15)
   .attr("width", 200)
   .attr("fill", "green");

var myCircle = svgContainer.append("circle")
   .attr("cx", 100)
   .attr("cy", 300)
   .attr("r", 250)
   .attr("fill", "Blue");
   .attr("stroke", "yellow");
   .attr("stroke-width", 20);
</script>

- svg_js.html
<!DOCTYPE html>
<html>
<head>
 <script src="https://d3js.org/d3.v5.min.js"></script>
</head>
<body>
  <svg width="800" height="800" id="mySvg">
  </svg>

</body>
</html>

<script>
var svgContainer = d3.select("#mySvg");
//method chaining
var myRectangle = svgContainer.append("rect")
   .attr("x", 200)
   .attr("y", 450)
   .attr("height", 15)
   .attr("width", 200)
   .attr("fill", "green");

var myCircle = svgContainer.append("circle")
   .attr("cx", 180)
   .attr("cy", 300)
   .attr("r", 150)
   .attr("fill", "Blue")
   .attr("stroke", "yellow")
   .attr("stroke-width", 20);

//myRectangle.attr("fill", "Black");
</script>

Week 10 - Arrays and External Data in D3
Appending an SVG to HTML elements
- appendToDiv.html
<!doctype html>
<html lang="en">
 <head>
 	<script src="https://d3js.org/d3.v5.min.js"></script>
 </head>
 <body>

	<div id="svg_area"></div>

 </body>
 <script>
	var svgContainer = d3.select("#svg_area").append("svg")
		.attr("height", 800)
		.attr("width", 800);

	var myRectangle = svgContainer.append("rect")
		.attr("x",50)
		.attr("y",50)
		.attr("height",100)
		.attr("width",100)
		.attr("fill","blue");
</script>
</html>
Introduction to Arrays
https://www.w3schools.com/js/js_arrays.asp
- Store one or multiple element in one variable.
- Each element is referred to by it's index.
var colours = ['Pink','Yellow','Green']
0: 'Pink'
1: 'Yellow'
2: 'Green'
//refer to yellow like this:
colours[1];

//some usefull method is arrays
colours.length
3
Samples of arrays is JavaScript
<script>
var myVar =  10;
var myArray = [1,2,3,4,5,6,7,8,9,10];

alert(myArray[10]);

</script>
Using Arrays to Generate SVG using D3
Using var for width
- svg_var.html
- <!doctype html>
- <html>
- <title>Home</title>
- <script src="https://d3js.org/d3.v5.js"></script>
- </head>
- <body>
- <div id="svg_area"></div>
- </body>
- </html>
- <script type="text/javascript">
- var myVar = 600;
- var svgContainer = d3.select("#svg_area").append("svg")
- .attr("height", 800)
- .attr("width", 800);
- var myRectangle = svgContainer.append("rect")
- .attr("x", 50)
- .attr("y", 50)
- .attr("height", 100)
- .attr("width", myVar)
- .attr("fill", "blue");
- </script>

Looping through an array with .enter()
- svg_arr_loop.html
- <!doctype html>
- <html>
- <head>
- <title>Home</title>
- <script src="https://d3js.org/d3.v5.js"></script>
- </head>
- <body>
- <div id="myDiv"></div>
- </body>
- </html>
- <script type="text/javascript">
- var myArray = [10, 22, 14, 16, 19, 9];
- let svgContainer = d3.select("#myDiv").append("svg")
- .attr("height", 1000)
- .attr("width", 1000);
- let circles = svgContainer.selectAll('circle')
- .data(myArray);
- // enter loops through
- circles.enter()
- .append("circle")
- // function will run and returns i (the index value of the array)
- .attr("cx", function(d, i){return 50 + (i*50);})
- .attr("cy", 50)
- .attr("r", function(d){return d;})
- .attr("fill", "blue");
- </script>

myRectangle.enter()
- svg_rect_loop.html
- <!doctype html>
- <html>
- <head>
- <title>Home</title>
- <script src="https://d3js.org/d3.v5.js"></script>
- </head>
- <body>
- <div id="myDiv"></div>
- </body>
- </html>
- <script type="text/javascript">
- var myArray = [100, 220, 20, 160, 190, 90, 320];
- let svgContainer = d3.select("#myDiv").append("svg")
- .attr("height", 1000)
- .attr("width", 1000);
- let myRectangle = svgContainer.selectAll('rect')
- .data(myArray);
- // enter loops through
- myRectangle.enter()
- .append("rect")
- // function will run and returns i (the index value of the array)
- // d = data, i = index
- .attr("x", function(d, i){return 50 + (i*110);})
- .attr("y", 50)
- .attr("width", 100)
- .attr("height", function(d){return d;})
- .attr("fill", "blue");
- </script>

Importing a File Using D3
- Create a CSV File
- Create a Python web server
- Import File 4)
- Output Result to SVG
- temp_data.csv
month,temp
January,4
February,5
March,8
April,12
May,18
June,20
July,21
August,23
September,18
October,12
November,7
December,5
- load_csv_from_file.html
- <!doctype html>
- <html lang="en">
- <head>
- <meta charset="UTF-8">
- <title>Document</title>
- <script src="https://d3js.org/d3.v5.min.js"></script>
- </head>
- <body>
- <div id="myDiv"></div>
- </body>
- <script>
- d3.csv("temp_data.csv").then(function(data) {
- console.log(data);
- });
- </script>
- </html>
csv
- Create a csv in excel
- Create a folder “mypythonwebserver”
- In terminal, type python -m http.server 5)
- start coding. save file to “mypythonwebserver”
- To view file, open in localhost. e.g http://localhost:8000/d3.html
<!doctype html>
<html lang="en">
 <head>
   <meta charset="UTF-8">
   <title>Document</title>
   <script src="https://d3js.org/d3.v5.min.js"></script>
 </head>
 <body>
   <div id="myDiv"></div>

 <script type="text/javascript">
   // import the data
   d3.csv("temp_data.csv").then(function(data) {
   console.log(data);
   // create the svg container using d3 select, append svg to div above
   let svgContainer = d3.select("#myDiv").append("svg")
      .attr("width", 800)
      .attr("height", 800);
    // create a variable and select all rectangles in svg containe as associate with data
    let myRectangle = svgContainer.selectAll("rect")
       .data(data);
    // using d3 enter method to add rectangles
    myRectangle.enter()
       .append("rect")
           .attr("x",function(d, i){
               return 50 + (i*21);
           })
           .attr("y", 50)
           .attr("width", 20)
           .attr("height",function(d){
               return d.temp * 10;
           })
           //.attr("fill", "red");
           .attr("fill", function(d){
               if(d.temp <=10) {return "blue";}
               else if (d.temp<=15){return "green";}
               else if (d.temp <=20){return "orange";}
               else {return "red";}});
           });
 </script>
</body>
</html>
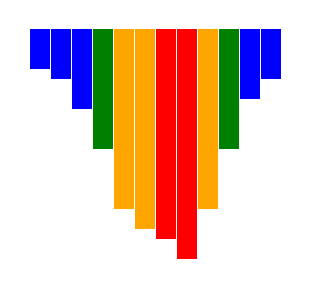
Week 11 - Charts and Labels in D3
Part 1- Baseline correction in D3

Part 2 - Adding labels in D3
<!doctype html>
<html lang ="en">
<head>
    <meta charset="UTF-8">
    <title>Document</title>
   <script src="https://d3js.org/d3.v5.js"></script>
</head>
<body>
<div id="myDiv"></div>
</body>

<script type="text/javascript">

//d3.csv("temp_data.csv").then(function(data)
// import the data
 d3.csv("temp_data.csv").then(function(data) {
 console.log(data);
 // create the svg container using d3 select, append svg to div above
 let svgContainer = d3.select("#myDiv").append("svg")
    .attr("width", 800)
    .attr("height", 800);
  // create a variable and select all rectangles in svg containe as associate with data
  let myRectangle = svgContainer.selectAll("rect")
     .data(data);
  // using d3 enter method to add rectangles
  myRectangle.enter()
     .append("rect")
         .attr("x",function(d, i){
             return 50 + (i*41);
         })
         .attr("y", function(d){
             return 300 - (d.temp *10);
         })
         .attr("width", 40)
         .attr("height",function(d){
             return d.temp * 10;
         })
         //.attr("fill", "red");
         .attr("fill", function(d){
             if(d.temp <=10) {return "blue";}
             else if (d.temp<=15){return "green";}
             else if (d.temp <=20){return "orange";}
             else {return "red";}
         });

    // Add label text for bar chart
    let mylabel = svgContainer.selectAll("text")
       .data(data);
    // using d3 enter method to add rectangles
    mylabel.enter()
       .append("text")
           .attr("x",function(d, i){
               return 70 + (i*41);
           })
           .attr("y", function(d){
               return 320 - (d.temp *10);
           })
        .attr("text-anchor", "middle")
        .attr("font-family", "sans-serif")
        .attr("font-size", "20px")
        .attr("fill", "white")
        .text(function(d){
            return d.temp + " \u00B0";
        });

             });


</script>
</html>

Part 3 - Transitions and Styles in D3
Using CSS to add Style
Using CSS to style SVG rectangles on hover
rect:hover{ fill:black;}
<!doctype html>
<html lang ="en">
<head>
    <meta charset="UTF-8">
    <title>Document</title>
   <script src="https://d3js.org/d3.v5.js"></script>
   <style>
   rect:hover{
       fill:black;
   }

   </style>
</head>
<body>
<div id="myDiv"></div>
</body>

<script type="text/javascript">

//d3.csv("temp_data.csv").then(function(data)
// import the data
 d3.csv("temp_data.csv").then(function(data) {
 console.log(data);
 // create the svg container using d3 select, append svg to div above
 let svgContainer = d3.select("#myDiv").append("svg")
    .attr("width", 800)
    .attr("height", 800);
  // create a variable and select all rectangles in svg containe as associate with data
  let myRectangle = svgContainer.selectAll("rect")
     .data(data);
  // using d3 enter method to add rectangles
  myRectangle.enter()
     .append("rect")
         .attr("x",function(d, i){
             return 50 + (i*41);
         })
         .attr("y", function(d){
             return 300 - (d.temp *10);
         })
         .attr("width", 40)
         .attr("height",function(d){
             return d.temp * 10;
         })
         //.attr("fill", "red");
         .attr("fill", function(d){
             if(d.temp <=10) {return "blue";}
             else if (d.temp<=15){return "green";}
             else if (d.temp <=20){return "orange";}
             else {return "red";}
         });

    // Add label text for bar chart
    let mylabel = svgContainer.selectAll("text")
       .data(data);
    // using d3 enter method to add rectangles
    mylabel.enter()
       .append("text")
           .attr("x",function(d, i){
               return 70 + (i*41);
           })
           .attr("y", function(d){
               return 320 - (d.temp *10);
           })
        .attr("text-anchor", "middle")
        .attr("font-family", "sans-serif")
        .attr("font-size", "20px")
        .attr("fill", "white")
        .text(function(d){
            return d.temp + " \u00B0";
        });

             });


</script>
</html>

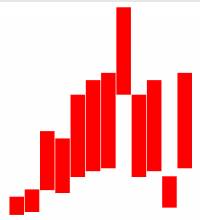
Transitions in D3.js
D3's .transition() method allows for easy transitions from one state to another.
Instead of applying changes instantaneously, transitions smoothly change from one state to a desired target state, over a given duration.
Transitions are created using the following code:
.transition()
Using the .transition() in conjunction with the .duration() method allows us to specify the time taken to change from the starting state to the finishing state.
The default value in 250 milliseconds. To change the default, a value is specified in the parentheses in the method, specifying the transition duration in milliseconds.
Transitions durations are created using the following code:
.transition(500)
<!doctype html>
<html lang ="en">
<head>
    <meta charset="UTF-8">
    <title>Document</title>
   <script src="https://d3js.org/d3.v5.js"></script>
   <style>
   rect:hover{
       fill:black;
   }

   </style>
</head>
<body>
<div id="myDiv"></div>
</body>

<script type="text/javascript">

//d3.csv("temp_data.csv").then(function(data)
// import the data
 d3.csv("temp_data.csv").then(function(data) {
 console.log(data);
 // create the svg container using d3 select, append svg to div above
 let svgContainer = d3.select("#myDiv").append("svg")
    .attr("width", 800)
    .attr("height", 800);
  // create a variable and select all rectangles in svg containe as associate with data
  let myRectangle = svgContainer.selectAll("rect")
     .data(data);
  // using d3 enter method to add rectangles
  myRectangle.enter()
     .append("rect")
         // start of transition
         .attr("fill", "black")
         .attr("x",function(d, i){
             return 50 + (i*41);
         })
         .attr("y", 300)
         .attr("width", 300)
         .transition()
         .duration(1000)
         // end of transition
         .attr("x",function(d, i){
             return 50 + (i*41);
         })
         .attr("y", function(d){
             return 300 - (d.temp *10);
         })
         .attr("width", 40)
         .attr("height",function(d){
             return d.temp * 10;
         })
         //.attr("fill", "red");
         .attr("fill", function(d){
             if(d.temp <=10) {return "blue";}
             else if (d.temp<=15){return "green";}
             else if (d.temp <=20){return "orange";}
             else {return "red";}
         });

    // Add label text for bar chart
    let mylabel = svgContainer.selectAll("text")
       .data(data);
    // using d3 enter method to add rectangles
    mylabel.enter()
       .append("text")
       .attr("x",function(d, i){
           return 70 + (i*41);
       })
       .attr("y", 300)
       .transition()
       .duration(3000)
           .attr("x",function(d, i){
               return 70 + (i*41);
           })
           .attr("y", function(d){
               return 320 - (d.temp *10);
           })
        .attr("text-anchor", "middle")
        .attr("font-family", "sans-serif")
        .attr("font-size", "20px")
        .attr("fill", "white")
        .text(function(d){
            return d.temp + " \u00B0";
        });

             });


</script>
</html>
Week 12 - Adding Scales and Axis in D3
Part 1 - Introduction to Scales in D3
In D3, scales are functions that map from an input domain to an output range.
var myScale = d3.scaleLinear();
//define the scale
var myScale = d3.scaleLinear()
    .domain([0,600])
    .range([0,600]);

//using the scale
myscale(400);
Part 2 - Creating Scales in D3
- sales.csv
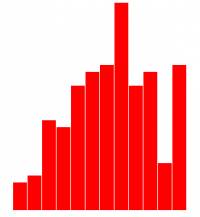
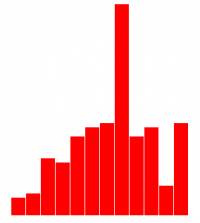
month,sales
January,40
February,50
March,130
April,120
May,180
June,200
July,210
August,480
September,180
October,200
November,68
December,210
No scaling so add the scaling code.
    var yScale =d3.scaleLinear()
      .domain([0,480])
      .range([0,300]);
Then apply the scaling in one spot only
Then in both spots…
Automatic Scaling
Use the d3.max feature to find the biggest number in the list to use in automatic scaling.
- filename.py
- //convert to numbers for d3.max to work properly in scaling
- data.forEach(function(d){
- d.sales = Number(d.sales);
- })
- // create a scale for y
- var yScale =d3.scaleLinear()
- .domain([0,d3.max(data, function(d){
- return d.sales;
- })])
In order for this to work however, all the strings need to be converted to numbers first. See the code lines two and three to tae care of this.
Then on line 7 use d3.max() and function(d) to set the max value for scaling taken automatically from the dataset.
Final Full Code
- scaled_svg.html
<!doctype html>
<html lang="en">
<head>
  <meta charset="UTF-8">
  <title>D3 Scaling</title>
  <script src="https://d3js.org/d3.v5.min.js"></script>
</head>
<body>
  <div id="myDiv"></div>
  <script type="text/javascript">
    // import the sales data
    d3.csv("sales.csv").then(function(data) {
    console.log(data);
    // create a scale for y
    var yScale =d3.scaleLinear()
      .domain([0,480])
      .range([0,300]);
    // create the svg container using d3 select, append svg to div above
    let svgContainer = d3.select("#myDiv").append("svg")
    .attr("width", 1000)
    .attr("height", 1000);
    //ceate a rectangle
    var myRectangle = svgContainer.selectAll("rect")
      .data(data);
    //add attributes to rectangle
    myRectangle.enter()
      .append("rect")
        .attr("x",function(d,i){
          return (50+(i*21));
          })
        .attr("y",function(d){
            return 300-yScale(d.sales);
          })
        .attr("width",20)
        .attr("height",function(d){
            return yScale(d.sales);
          })
        .attr("fill","red");

    });
  </script>
</body>
</html>
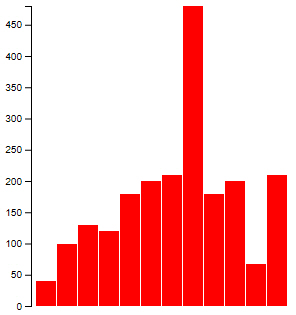
Part 3 - Creating Axes in D3
This section covers the code to generate the axis on the graph. The code that is used to do this is as follow:
var xAxis = d3.axixTop();
var xAxis = d3.axixBottom();
var yAxis = d3.axixLeft();
var yAxis = d3.axixRight();
Code to define the axis.
var xAxis = d3.axisBotom()
  .scale(myScale);
Now the axix needs to be positioned on the screen. Todo this we need to append the axis to the svg container.
    //append the axix to the svg container referincing the svg group **"g"**
    svg.append("g")
      .call(xAxis)
now that the axix exist we need to add and start drawing it to the screen with call(xAxis)
Position the axix using transformations. The translate values determines how many pixels to move the axis horizontally and vertically, so in example ten pixels from the left and 45 down.
    //append the axix to the svg container referincing the svg group **"g"**
    svg.append("g")
      .attr("transform", "translate(10, 45)")
      .call(xAxis)
Full Axis Code implemented
- d3js_axis.html
<!doctype html>
<html lang="en">
<head>
  <meta charset="UTF-8">
  <title>D3 Scaling</title>
  <script src="https://d3js.org/d3.v5.min.js"></script>
</head>
<body>
  <div id="myDiv"></div>
  <script type="text/javascript">
    // import the sales data
    d3.csv("sales.csv").then(function(data) {
    console.log(data);
    //convert to numbers for d3.max to work properly in scaling
    data.forEach(function(d){
      d.sales = Number(d.sales);
    })
    // create a scale for y
    var yScale =d3.scaleLinear()
      .domain([0,d3.max(data, function(d){
        return d.sales;
      })])
      .range([300,0]);
    //create y Axis
    var yAxis = d3.axisLeft()
        .scale(yScale)
    // create the svg container using d3 select, append svg to div above
    let svgContainer = d3.select("#myDiv").append("svg")
    .attr("width", 1000)
    .attr("height", 1000);
    //ceate a rectangle
    var myRectangle = svgContainer.selectAll("rect")
      .data(data);
    //add attributes to rectangle
    myRectangle.enter()
      .append("rect")
        .attr("x",function(d,i){
          return (50+(i*21));
          })
        .attr("y",function(d){
            return yScale(d.sales);
          })
        .attr("width",20)
        .attr("height",function(d){
            return 300-yScale(d.sales);
          })
        .attr("fill","red");
    //To ensure that the axis is shown on top we do it here after the bars are drawn
    //We will be appending "svgContainer" declared above on line 28
    svgContainer.append("g")
      .attr("transform", "translate(45,0)")
      .call(yAxis);
    });
  </script>
</body>
</html>
Week 13 - Allowing the user to specify chart settings
- d3js_user_input.html
<!doctype html>
<html lang ="en">
<head>
  <meta charset="UTF-8">
  <title>D3 Scaling</title>
  <script src="https://d3js.org/d3.v5.min.js"></script>
</head>
<body>
Select chart height:
<select name="" id="chartHeight">
    <option value="300">300 pixels</option>
    <option value="600">600 pixels</option>
    <option value="900">900 pixels</option>
</select>

Select chart color:
<input type="color" id="colorPicker">

<button onclick="drawChart()">Draw Chart</button>
  <div id="myDiv"></div>

</body>

<script type="text/javascript">

function drawChart(){
  // import the sales data
     d3.csv("sales.csv").then(function(data) {
     console.log(data);

     // values for bar chart
     var height = document.getElementById('chartHeight').value;
     var width = 600;
     var dataCount = data.length;
     var gap = 2;
     var chartColor = document.getElementById('colorPicker').value;
     //convert to numbers for d3.max to work properly in scaling
     data.forEach(function(d){
       d.sales = Number(d.sales);
     })
     // create a scale for y
     var yScale =d3.scaleLinear()
       .domain([0,d3.max(data, function(d){
         return d.sales;
       })])
       .range([height,0]);
      // create a scale for x
      var xScale = d3.scaleBand()
          .domain(data.map(function(d){
              return d.month;
          }))
          .range([0, width])
     //create y Axis
     var yAxis = d3.axisLeft()
         .scale(yScale)
         //create y Axis
    var xAxis = d3.axisBottom()
         .scale(xScale);

    //removes previous code
    d3.select("#myDiv").selectAll("*").remove();
     // create the svg container using d3 select, append svg to div above
     let svgContainer = d3.select("#myDiv").append("svg")
     .attr("width", 1000)
     .attr("height", 1000);
     //ceate a rectangle
     var myRectangle = svgContainer.selectAll("rect")
       .data(data);
     //add attributes to rectangle
     myRectangle.enter()
       .append("rect")
         .attr("x",function(d,i){
           return (50+(i*(width/dataCount)));
           })
         .attr("y",function(d){
             return yScale(d.sales);
           })
         .attr("width",(width/dataCount -gap))
         .attr("height",function(d){
             return height-yScale(d.sales);
           })
         .attr("fill",chartColor);
     //To ensure that the axis is shown on top we do it here after the bars are drawn
     //We will be appending "svgContainer" declared above on line 28
     svgContainer.append("g")
       .attr("transform", "translate(45,0)")
       .call(yAxis);

     svgContainer.append("g")
       .attr("transform", "translate(50," +height+")")
       .call(xAxis)
       .selectAll("text")
           .attr("transform", "rotate(60)")
           .attr("text-anchor", "start")
           .attr("x", "9")
           .attr("y", "3");
     });
 }
  </script>

</html>

modules/46376.txt · Last modified: 2020/06/20 14:39 by 127.0.0.1